The following is a summary of New Brunswick’s population conundrum in six charts.
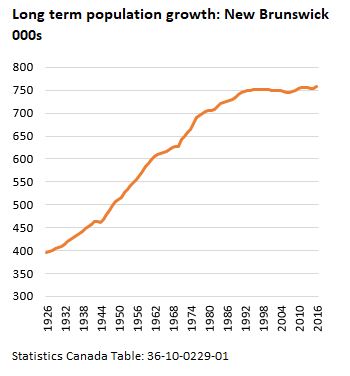
New Brunswick’s population increased for the most part every year between 1926 and the 1990s. Lots of young people = lots of young families = lots of children. But as the chart shows population pretty much flatlined way back in the early 1990s at around 750,000 – it is up only marginally since.
But New Brunswickers were familiar with ‘goin’ down the road’. They knew that at least some of their kids would leave because of high unemployment and a perceived lack of opportunity at home. The chart shows the net interprovincial migration from New Brunswick in five year increments. The last time we had a positive migration by this measure (more moving in that out from other provinces) was in the early 1970s. 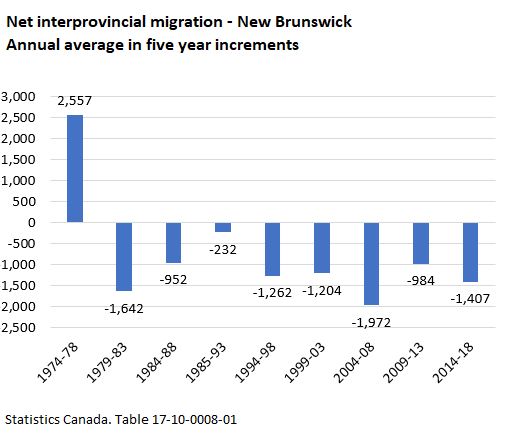
The population essentially stopped growing in the 1990s but it also started to age more rapidly. The median age went from 23 in the 1970s to around 45 now. As shown in the chart in the early 1970s there were 2.4 births for every death. Now there are more deaths than births in New Brunswick. 
This aging population has substantial labour market implications. In the early 1970s there were 4.3 people under the age of 25 for every one person over the age of 60. In other words there was as substantial surplus of labour that was used to drive economic growth – entrepreneurs set up businesses and national firms moved operations here – and there was still enough of a surplus that led to a outward migration and above average unemployment (although unemployment has always been exaggerated because of seasonal EI).

So what do we do? While the rest of the country (overall) saw a big increase in immigration in the 1990s right after David Foot’s book predicting a demographic crisis. New Brunswick pretty much didn’t do anything on the immigration front until the early 2000s. The 2001 Census found New Brunswick’s population had declined between Census periods for the first time since the Great Depression. The government set up the Population Growth Secretariat and there was as small uptick in immigration. Around 2011-2012 companies started to report serious concerns about the lack of workers and then we started to see a big increase in immigration. We are still well below the national immigration rate per 10,000 population but heading in the right direction.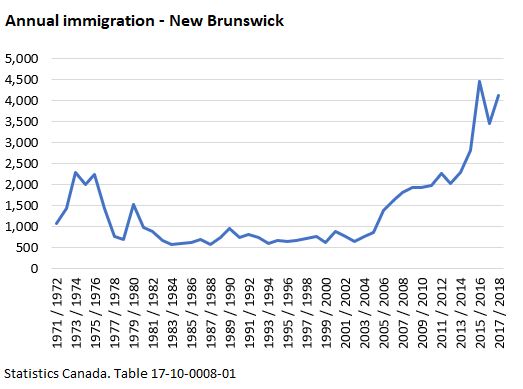
But as a thought experiment think about how many young people under the age of 25 we would need to get back that ratio in the early 1970s – that lead to the rise of a number of new industries in New Brunswick. If we wanted 4.3 young people for every one person over the age of 60 we would need an additional 728,000 people under the age of 25. Crazy, huh? Even if we wanted to get back to the ratio just in 1997 – we would need another 232,000 people under the age of 25 immediately.
That should put it into perspective for you. Just to replace retirees and provide workers for a very modest growth in the labour market, we will need to get our immigration levels up to 10,000 per year or higher, IMO (from around 4,000 today).
The last chart is a little more controversial. Most economists do tie the lack of urbanization in New Brunswick to our economic and population challenges. From WWII until the early 1970s we ‘urbanized’ at a fairly strong clip. Then we went backwards and we are still below 50% compared to over 80% nationally. As I have stated many times this is not because we haven’t emptied our rural areas fast enough – it is because we haven’t grown urban centres fast enough. Across Canada the number of people living in rural areas has increased since the 1950s. The difference is that across the country the urban population has risen by something like 18 million. 
There you go, New Brunswick in six charts.
Interesting but like most charts/statistics it doesn’t tell the whole story. While I agree with the trend and the need for more immigration, comparing numbers from the past to the present is irrelevant. The workforce of the past is not comparable to today and presumably the future. Automation and ‘knowledge’ based work requires less ‘labour’ i.e. workers than previous decades. Maybe we should be looking at what we need to do to build an intelligent workforce for the future rather than bulking up numbers thinking that will solve our woes.
I can’t help but wonder what exactly sparked the sudden and sustained surge of urbanization in NB at the beginning of WWII. Was it the War Effort itself that drove the spike, or something else? Perhaps post-depression uncertainty driving urbanization?
Would be an interesting thing to learn more on.
Instead of an unsustainable metric like perpetual population growth what about things like wage growth or housing affordability?